Archive

Archive for the ‘U.S. Department of Commerce’ Category

NOAA predicts a near-normal 2012 Atlantic hurricane season

May 30, 2012 Comments off

NOAA predicts a near-normal 2012 Atlantic hurricane season
Source: National Oceanic and Atmospheric Administration

Conditions in the atmosphere and the ocean favor a near-normal hurricane season in the Atlantic Basin this season, NOAA announced today from Miami at its Atlantic Oceanographic and Meteorological Laboratory, and home to the Hurricane Research Division.

For the entire six-month season, which begins June 1, NOAA’s Climate Prediction Center says there’s a 70 percent chance of nine to 15 named storms (with top winds of 39 mph or higher), of which four to eight will strengthen to a hurricane (with top winds of 74 mph or higher) and of those one to three will become major hurricanes (with top winds of 111 mph or higher, ranking Category 3, 4 or 5). Based on the period 1981-2010, an average season produces 12 named storms with six hurricanes, including three major hurricanes.

See also: NOAA predicts near-normal Eastern Pacific hurricane season
See also: NOAA expects below-normal Central Pacific hurricane season

Census Bureau Releases Estimates of Undercount and Overcount in the 2010 Census

May 26, 2012 Comments off

Census Bureau Releases Estimates of Undercount and Overcount in the 2010 Census
Source: U.S. Census Bureau

The U.S. Census Bureau released today results from its post-enumeration survey, providing a measure of the accuracy of the 2010 Census. The results found that the 2010 Census had a net overcount of 0.01 percent, meaning about 36,000 people were overcounted in the census. This sample-based result, however, was not statistically different from zero.

The post-enumeration survey, called “Census Coverage Measurement,” measures the coverage of the nation’s household population (excluding the 8.0 million people in “group quarters,” such as nursing homes or college dorms). It surveys a sample of the 300.7 million people living in housing units and then matches the responses to the census, resulting in estimates of error.

The 2000 Census had an estimated net overcount of 0.49 percent and the 1990 Census had a net undercount of 1.61 percent.

“On this one evaluation — the net undercount of the total population — this was an outstanding census,” Census Bureau Director Robert Groves said. “When this fact is added to prior positive evaluations, the American public can be proud of the 2010 Census their participation made possible.”

Most Children Younger Than Age 1 are Minorities, Census Bureau Reports

May 17, 2012 Comments off

Most Children Younger Than Age 1 are Minorities, Census Bureau ReportsSource: U.S. Census Bureau

The U.S. Census Bureau today released a set of estimates showing that 50.4 percent of our nation’s population younger than age 1 were minorities as of July 1, 2011. This is up from 49.5 percent from the 2010 Census taken April 1, 2010. A minority is anyone who is not single-race white and not Hispanic.

The population younger than age 5 was 49.7 percent minority in 2011, up from 49.0 percent in 2010. A population greater than 50 percent minority is considered “majority-minority.”

These are the first set of population estimates by race, Hispanic origin, age and sex since the 2010 Census. They examine population change for these groups nationally, as well as within all states and counties, between Census Day (April 1, 2010) and July 1, 2011. Also released were population estimates for Puerto Rico and its municipios by age and sex.

There were 114 million minorities in 2011, or 36.6 percent of the U.S. population. In 2010, it stood at 36.1 percent.

There were five majority-minority states or equivalents in 2011: Hawaii (77.1 percent minority), the District of Columbia (64.7 percent), California (60.3 percent), New Mexico (59.8 percent) and Texas (55.2 percent). No other state had a minority population greater than 46.4 percent of the total.

More than 11 percent (348) of the nation’s 3,143 counties were majority-minority as of July 1, 2011, with nine of these counties achieving this status since April 1, 2010. Maverick, Texas, had the largest share (96.8 percent) of its population in minority groups, followed by Webb, Texas (96.4 percent) and Wade Hampton Census Area, Alaska (96.2 percent).

2010 Census Shows More than Half of Native Hawaiians and Other Pacific Islanders Report Multiple Races

May 12, 2012 Comments off

2010 Census Shows More than Half of Native Hawaiians and Other Pacific Islanders Report Multiple Races
Source: U.S. Department of the Census

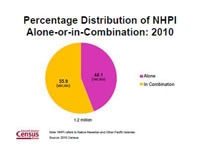
The U.S. Census Bureau released today a 2010 Census brief, The Native Hawaiian and Other Pacific Islander Population: 2010 [PDF], that shows more than half (56 percent) of this population, or 685,000 people, reported being Native Hawaiian and Other Pacific Islander in combination with one or more other races. This multiracial group grew by 44 percent from 2000 to 2010.

Percentage Distribution of NHPI Alone-or-in-Combinatkion:2010

Overall, 1.2 million people, or 0.4 percent of all people in the United States, identified as Native Hawaiian and Other Pacific Islander (NHPI), either alone or in combination with one or more races. This population grew by 40 percent from

2000 to 2010. Those who reported being Native Hawaiian and Other Pacific Islander alone totaled 540,000, an increase of 35 percent from 2000 to 2010. The multiple-race Native Hawaiian and Other Pacific Islander population, as well as both the alone and alone-or-in-combination populations, all grew at a faster rate than the total U.S. population, which increased by 9.7 percent from 2000 to 2010.

Census Bureau Reports Foreign-Born Households are Larger, Include More Children and Grandparents

May 11, 2012 Comments off

Census Bureau Reports Foreign-Born Households are Larger, Include More Children and Grandparents
Source: U.S. Census Bureau

The U.S. Census Bureau reported today that foreign-born households are, on average, larger than native households, have more children under age 18, and are more likely to be multigenerational.

The average size of foreign-born households (3.4 people) was larger than that of native-born households (2.5 people). About 62 percent of foreign-born family households included children under 18, compared with 47 percent of native-born households. Multigenerational households, with three or more generations living together, were more common among foreign-born (10 percent) than native-born (5 percent) family households.

Among the regions of birth, family households with a householder born in Latin America and the Caribbean were the most likely to include children under 18 (70 percent), followed by Africa (67 percent), Oceania (60 percent) and Asia (56 percent). Families with a householder born in Northern America or Europe (both less than 40 percent) were less likely to include children under 18 than native-born households. (Oceania consists of Australia, New Zealand, Melanesia, Micronesia and Polynesia; Northern America consists of Canada, Bermuda, Greenland, and St. Pierre and Miquelon.)

A family household consists of a householder and one or more people living together who are related to the householder by birth, marriage or adoption. About 77 percent of foreign-born households were family households, compared with 65 percent of native-born households.

These data come from The Foreign-Born Population in the United States: 2010, a new report about the characteristics of the nation’s foreign-born population from the 2010 American Community Survey (ACS). The report also examines differences among foreign-born region-of- birth groups on a wide range of topics that include age, sex, marital status, fertility, period of entry into the United States, naturalization and citizenship status, language, education, labor force participation, occupation, health insurance coverage, income and poverty.

“There is considerable variation among the different foreign-born groups in household type and composition,” said Elizabeth M. Grieco, chief of the Census Bureau’s Foreign-Born Population Branch and one of the authors of the report. “This diversity is also seen in the other demographic, social and economic characteristics covered in this report.”

+ Full Report (PDF)

2010 Business Dynamics Statistics (BDS)

May 4, 2012 Comments off

2010 Business Dynamics Statistics (BDS)
Source: U.S. Census Bureau

This Census Bureau brief highlights the most recent update to the Business Dynamics Statistics, which found that U.S. business startups have been declining since the 1980s and especially during the 2008-2009 recession. The report concludes that the U.S. has become less entrepreneurial as a result of the decline in startups and the lack of activity by young businesses. The BDS, which provides annual statistics from 1976 to 2010 by firm age and size, is crucial to understanding current and historical U.S. entrepreneurial activity. The BDS results from collaboration between the U.S. Census Bureau’s Center for Economic Studies and the Ewing Marion Kauffman Foundation, the largest American nonprofit organization that focuses on entrepreneurship. Internet address: <http://www.kauffman.org/bds2012>.

Further information on the BDS release can be found at <http://www.census.gov/ces/dataproducts/bds/data.html>.

2010 Census Shows Interracial and Interethnic Married Couples Grew by 28 Percent over Decade

April 27, 2012 Comments off

2010 Census Shows Interracial and Interethnic Married Couples Grew by 28 Percent over Decade
Source: U.S. Census Bureau

The U.S. Census Bureau today released a 2010 Census brief, Households and Families: 2010, that showed interracial or interethnic opposite-sex married couple households grew by 28 percent over the decade from 7 percent in 2000 to 10 percent in 2010. States with higher percentages of couples of a different race or Hispanic origin in 2010 were primarily located in the western and southwestern parts of the United States, along with Hawaii and Alaska.

A higher percentage of unmarried partners were interracial or interethnic than married couples. Nationally, 10 percent of opposite-sex married couples had partners of a different race or Hispanic origin, compared with 18 percent of opposite-sex unmarried partners and 21 percent of same-sex unmarried partners.

+ Households and Families: 2010 (PDF)

Local Area Personal Income, 2010

April 27, 2012 Comments off

Local Area Personal Income, 2010
Source: Bureau of Economic Analysis

Personal income in large counties
Personal income in large counties–counties with population of at least 250,000–represent 8 percent of the 3,113 counties in the U.S., but account for 68 percent of personal income for the nation. In these 261 counties for 2010:

    <li<Net earnings (primarily wages and salaries, supplements, and proprietors’ income, less contributions for government social insurance) comprised 66 percent of personal income, while property income (personal dividends, interest, and rent) contributed 17 percent and transfer receipts (including Social Security, Medicare, and unemployment insurance) made up 17 percent.

  • Net earnings grew 3.0 percent, up from -5.5 percent in 2009. Property income grew 2.9 percent, up from -16.7 percent. Transfer receipts grew 7.3 percent, down from 14.1 percent.
  • Personal income growth ranged from 8.7 percent in Loudoun, Virginia to -2.8 percent in St. Joseph, Indiana.
    <li<Per capita personal income ranged from $111,386 in New York (Manhattan), New York to $20,946 in Hidalgo, Texas.


Personal income in medium counties

Personal income in medium counties–counties with population from 50,000 to 249,999–represent 23 percent of all U.S. counties, and account for 22 percent of personal income for the nation. In these 718 counties for 2010:

  • Net earnings comprised 63 percent of personal income, while property income contributed 16 percent and transfer receipts made up 21 percent.
  • Net earnings grew 2.9 percent, up from -3.4 percent in 2009. Property income grew 2.9 percent, up from -15.2 percent. Transfer receipts grew 6.0 percent, down from 13.8 percent.
  • Personal income growth ranged from 12.5 percent in Eddy, New Mexico to -4.4 percent in Christian, Kentucky.
  • Per capita personal income ranged from $79,967 in Arlington, Virginia to $18,259 in Starr Texas.

Personal income in small counties
Personal income in small counties–counties with population less than 50,000–represent 69 percent of all U.S. counties, and account for 10 percent of personal income for the nation. In these 2,134 counties for 2010:

  • Net earnings comprised 58 percent of personal income, while property income contributed 16 percent and transfer receipts made up 26 percent.
  • Net earnings grew 3.8 percent, up from -5.0 percent in 2009. Property income grew 2.3 percent, up from -12.7 percent. Transfer receipts grew 5.2 percent, down from 12.4 percent.
  • Personal income growth ranged from 51.6 percent in Hyde, South Dakota to -18.8 percent in Hand, South Dakota.
  • Per capita personal income ranged from $94,672 in Teton, Wyoming to $16,299 in Crowley, Colorado.

March 2012 Heat Wave

April 13, 2012 Comments off

March 2012 Heat Wave
Source: National Oceanic and Atmospheric Administration

Numerous cities broke temperature records for January-March (year-to-date, or YTD). The following map and table present some of these record averages. Each city listed observed its warmest YTD period. Also included are the running minimum and maximum temperatures with respect to the top 5 average YTD temperatures.

New — Intellectual Property and the U.S. Economy: Industries in Focus

April 11, 2012 Comments off

Intellectual Property and the U.S. Economy: Industries in Focus
Source: U.S. Department of Commerce

Innovation—the process through which new ideas are generated and successfully introduced in the marketplace—is a primary driver of U.S. economic growth and national competitiveness.[1] Likewise, U.S. companies’ use of trademarks to distinguish their goods and services from those of competitors represents an additional support for innovation, enabling firms to capture market share, which contributes to growth in our economy. The granting and protection of intellectual property rights is vital to promoting innovation and creativity and is an essential element of our free-enterprise, market-based system. Patents, trademarks, and copyrights are the principal means used to establish ownership of inventions and creative ideas in their various forms, providing a legal foundation to generate tangible benefits from innovation for companies, workers, and consumers. Without this framework, the creators of intellectual property would tend to lose the economic fruits of their own work, thereby undermining the incentives to undertake the investments necessary to develop the IP in the first place.[2] Moreover, without IP protection, the inventor who had invested time and money in developing the new product or service (sunk costs) would always be at a disadvantage to the new firm that could just copy and market the product without having to recoup any sunk costs or pay the higher salaries required by those with the creative talents and skills. As a result, the benefits associated with American ingenuity would tend to more easily flow outside of the United States.

IP is used everywhere in the economy, and IP rights support innovation and creativity in virtually every U.S. industry. While IP rights play a large role in generating economic growth, little attention has been given to identifying which industries produce or use significant amounts of IP and rely most intensively on these rights. This report begins such an investigation by developing several industry-level metrics on IP use and employing these measures to identify a set of the most IP-intensive industries in the U.S. economy. To develop the industry-level metrics discussed, several databases were used, some of which (for the patent and trademark analyses) are publicly available.[3] In the future, more user-friendly sets of these patent and trademark data will be made available on the U.S. Patent and Trademark Office (USPTO) website.

This report employs USPTO administrative data to identify the industries that most intensively use the protection offered by patents and trademarks. For copyrights, the report identifies the set of industries primarily responsible for both the creation and production of copyrighted materials. The report then uses standard statistical methods to identify which American industries are the most patent-, trademark-, and copyright-intensive, and defines this subset of industries as “IP-intensive.” Using data collected from sources across the U.S. government, the report examines both the important trends and economic characteristics of these highly IP intensive industries and their meaningful contributions to the U.S. economy. There are several important findings contained in the report.

According to the analysis in this report, the direct and indirect employment in these industries is substantial: Direct employment in the subset of most IP-intensive industries identified in this report amounted to 27.1 million jobs in 2010, while indirect activities associated with these industries provided an additional 12.9 million jobs throughout the economy in 2010, for a total of 40.0 million jobs, or 27.7 percent of all jobs in the economy.

Census Estimates Show New Patterns of Growth Nationwide

April 6, 2012 Comments off

Census Estimates Show New Patterns of Growth NationwideSource: U.S. Census Bureau

Among the 50 fastest-growing metro areas over the last decade, only 24 of them were also among the 50 fastest growing since the 2010 Census. This is according to the first set of U.S. Census Bureau metropolitan statistical area, micropolitan statistical area and county population estimates to be published since the official 2010 Census population counts were released a year ago.

“Our nation is constantly changing, and these estimates provide us with our first measure of how much substate areas have grown or declined in total population since Census Day, April 1, 2010,” Census Bureau Director Robert Groves said. “We’re already seeing different patterns of population growth than we saw in the last decade.”

According to the new July 1, 2011, population estimates released today, the relative growth of many of the nation’s 366 metro areas in the 15-month period from April 2010 to July 2011 differed markedly from that observed between 2000 and 2010. One such example was Palm Coast, Fla., which was the fastest-growing metro area between 2000 and 2010, but fell to 55th place between 2010 and 2011. Similarly, Las Vegas, the third fastest-growing metro area between 2000 and 2010, fell to 151st place. Some metro areas showed less change: St. George, Utah, the second fastest-growing metro area between 2000 and 2010, dropped only to 11th place.

Conversely, New Orleans, which experienced the greatest percentage loss between 2000 and 2010, was 35th in metro area percentage growth between 2010 and 2011. Besides New Orleans, there were nine metro areas that were not among the 100 fastest growing between 2000 and 2010 but were among the 50 fastest growing from 2010 to 2011: Hinesville-Fort Stewart, Ga.; Columbus, Ga.-Ala.; Odessa, Texas; Fayetteville, N.C.; Oklahoma City, Okla.; Bismarck, N.D.; Miami-Fort Lauderdale-Pompano Beach, Fla.; Gulfport-Biloxi, Miss.; and Hattiesburg, Miss.

Kennewick-Pasco-Richland, Wash., and Austin-Round Rock-San Marcos, Texas, were the nation’s two fastest-growing metro areas between 2010 and 2011, with population increases of 4.3 percent and 3.9 percent, respectively.

Facts for Features Special Edition — 1940 Census Records Release

April 4, 2012 Comments off

Facts for Features Special Edition — 1940 Census Records ReleaseSource: U.S. Census Bureau

On April 2, the National Archives and Records Administration will make individual records from the 1940 Census available to the public for the first time. The 1940 Census was conducted during a momentous time in our nation’s history, as the Great Depression was winding down and not long before our entry into World War II (although the war was already raging in Europe). It marked the only census conducted during the lengthy presidency of Franklin D. Roosevelt. It was also notable for many other reasons, as detailed below. In this edition of Profile America Facts for Features, we compare notable 1940 Census facts with corresponding information from the 2010 Census. Included is an early look at plans for the 2020 Census.

CRS — Commerce, Justice, Science, and Related Agencies: FY2013 Appropriations

April 3, 2012 Comments off

Commerce, Justice, Science, and Related Agencies: FY2013 Appropriations (PDF)
Source: Congressional Research Service (via Federation of American Scientists)

On February 13, 2012, President Obama submitted his FY2013 budget to Congress. The Administration requests a total of $62.076 billion for the agencies and bureaus funded as a part of the annual Commerce, Justice, Science, and Related Agencies (CJS) appropriations bill. The Administration’s request includes $7.978 billion for the Department of Commerce, $28.079 billion for the Department of Justice, $25.090 billion for the science agencies, and $929.2 million for the related agencies. The FY2013 request for CJS is 1.9% greater than the FY2012 appropriation of $60.910 billion.

On November 18, 2011, President Obama signed into law the Consolidated and Further Continuing Appropriations Act, 2012 (P.L. 112-55), which included the Commerce, Justice, Science, and Related Agencies Appropriations Act, 2012 (Division B). The act included $60.910 billion for CJS, of which $7.808 billion was for the Department of Commerce, $27.408 billion was for the Department of Justice, $24.838 billion was for the science agencies, and $856.6 million was for the related agencies.
This report will track and describe actions taken by the Administration and Congress to provide FY2013 appropriations for CJS accounts. It also provides an overview of FY2012 appropriations for agencies and bureaus funded as a part of the annual appropriation for CJS.

The source for the FY2012-enacted amounts is the conference report for the Consolidated and Further Continuing Appropriations Act, 2012 (P.L. 112-55, H.Rept. 112-284). FY2013-requested amounts were taken from the congressional budget submissions for the Department of Commerce, the Department of Justice, the Executive Office of the President, the National Aeronautics and Space Administration, the National Science Foundation, and the appendix to the Budget of the United States Government, Fiscal Year 2013.

Census Bureau Releases First Information Since 2000 Census on Moves Between Counties

March 29, 2012 Comments off

Census Bureau Releases First Information Since 2000 Census on Moves Between Counties
Source: U.S. Census Bureau

The U.S. Census Bureau today released estimates from the American Community Survey showing how many people migrated from one specific county to another during the course of a year ─ the first such numbers published since these data were collected as part of the 2000 Census.

The American Community Survey compiles data over a five-year period and asks people where they lived one year prior to being surveyed. The first five-year estimates released covers the years from 2005 to 2009.

The 2005-2009 American Community Survey County-to-County Migration Files provide tables for each county in the nation, showing both “inflows” and “outflows.” Inflows are the number of people living in a given county who lived in another specific county one year earlier; outflows represent the number of people who lived in a particular county one year earlier who subsequently moved to another specific county.

Of the 48.1 million people who lived in a different residence in the United States one year earlier, 17.7 million lived in a different county.

Maricopa, Ariz., had the largest number of inflows of people for any single county in the nation. People moved there from 993 different counties. Similarly, Maricopa led the nation with the largest number of counties in which it sent outflows of people ─ a total of 1,156 counties. This means that individuals leaving Maricopa were more dispersed throughout the country than individuals leaving any other county. Pinal, Ariz. (13,452 residents); Los Angeles (12,403); Pima, Ariz. (7,349); San Diego (6,693); and Coconino, Ariz. (3,994) were among the counties with the highest number of people moving into Maricopa.

Pinal (21,974), Pima (8,464), San Diego (4,156), Los Angeles (3,813) and Coconino (3,188) were among the counties with the highest number of moves out of Maricopa.

All in all, the most common county-to-county moves nationally were from Los Angeles to San Bernardino, Calif. (48,456 people) and Los Angeles to Orange, Calif. (41,612). Los Angeles to Riverside, Calif. (29,710); Orange, Calif., to Los Angeles (29,345); and Miami-Dade to Broward, Fla. (27,010) were among the next most common county-to-county moves.

Additionally, Los Angeles had both the highest number of people entering from another county as well as the highest number leaving for another county. On balance, however, it lost a net of about 160,000 people in this exchange.
An Assessment of the Viability of Accommodating Wireless Broadband in the 1755 – 1850 MHz Band

March 29, 2012 Comments off

An Assessment of the Viability of Accommodating Wireless Broadband in the 1755 – 1850 MHz Band (PDF)Source: U.S. Department of Commerce

The Department of Commerce’s National Telecommunications and Information Administration (NTIA) led an interagency group to determine the viability of accommodating commercial wireless broadband in the 1755-1850 MHz band. While the analyses summarized in this report indicates there are a number of challenges to repurposing, NTIA concludes that it is possible to repurpose all 95 megahertz of the band. The challenges still to be met include the high cost and long timeline of the undertaking, estimated to be approximately $18 billion over 10 years, assuming relocation of most existing federal users, not including costs to incumbent systems in comparable destination bands.

However, the extent to which the spectrum can be made exclusively available to commercial interests requires further investigation, as some federal systems could remain in the band indefinitely. As a step toward meeting these challenges, NTIA believes that the agencies need to engage with industry to identify potential solutions, which could include partial clearing scenarios and a phased approach to commercial auctions and entry. NTIA also believes that spectrum sharing is a vital component of satisfying the growing demand for access to spectrum and that both federal and non-federal users will need to adopt innovative sharing techniques to accommodate this demand. This analysis results from an eight-month evaluation process led by NTIA and engaging, via the Policy and Plans Steering Group (PPSG), the predominant federal agency users of this band. 2 Each federal agency analyzed and documented its ability to relocate systems, associated costs, and anticipated periods of transition. In conducting the analysis, NTIA and the federal agencies endeavored to protect critical federal operations from disruption and to reach comparable capability via other spectrum, commercial services, or means that do not utilize spectrum, where appropriate.

U.S. Commerce Department Releases Data Showing Tourism Spending Increased 8.1 percent in 2011, Supporting an Additional 103,000 Tourism-Related Jobs

March 24, 2012 Comments off

U.S. Commerce Department Releases Data Showing Tourism Spending Increased 8.1 percent in 2011, Supporting an Additional 103,000 Tourism-Related Jobs
Source: U.S. Department of Commerce

The U.S. Department of Commerce today released tourism data revealing that international and domestic tourism spending increased 8.1 percent in 2011, supporting an additional 103,000 jobs for a total of 7.6 million. A big factor in the increase was a surge in international visitors to our country: in 2011, 62 million international visitors came to the United States, an increase of 2.5 million from the year before. These international visitors spent an all time record of $153 billion on U.S. travel and tourism-related goods and services. The large volume of international visitors makes travel and tourism our number-one service export. These figures come on the heels of President Obama’s announcement of new initiatives to significantly increase travel and tourism in the U.S.

+ 2011 Release on International Visitation to the United States

Risk of major flooding in spring is low for the first time in four years

March 22, 2012 Comments off

Risk of major flooding in spring is low for the first time in four years
Source: National Oceanic and Atmospheric Administration (NOAA)

For the first time in four years, no area of the country faces a high risk of major to record spring flooding, largely due to the limited winter snowfall, according to NOAA’s annual Spring Outlook, which forecasts the potential for flooding from April to June.

“We’re not forecasting a repeat of recent historic and prolonged flooding in the central and northern U.S., and that is a relief,” said Laura Furgione, deputy director, NOAA’s National Weather Service. “The severity of any flooding this year will be driven by rainfall more so than the melting of the current snowpack.”

The Ohio River basin including portions of Illinois, Indiana, and Kentucky, along with parts of Louisiana and Mississippi are the only areas with an above-normal risk of flooding as soil moisture and river levels are currently above normal. Additionally, odds favor above-average April rainfall for the Ohio River basin.

River and stream water levels are normal to below normal for most of the country and there is less snow pack than in previous years. As a result, there is a normal flood risk from the Northeast, through the mid-Atlantic, across most of the northern Plains and into the Northwest. However, heavy spring rainfall can lead to flooding at any time, even in areas where overall risk is considered at or even below normal.

+ National Hydrologic Assessment

NIST Releases Technical Guidance for Evaluating Electronic Health Records

March 21, 2012 Comments off

NIST Releases Technical Guidance for Evaluating Electronic Health Records
Source: National Institute of Standards and Technology

An important aspect of any product is how easily someone can use it for its intended purpose, also known as usability. Electronic health records (EHR) that are usable have the potential to improve patient care, which is why the National Institute of Standards and Technology (NIST) has outlined formal procedures for evaluating the usability of EHR systems.

The proposed usability protocol encourages a user-centered approach to the development of EHR systems. It provides methods to measure and address critical errors in user performance before those systems are deployed in a medical setting.

“This guidance can be a useful tool for EHR developers to demonstrate that their systems don’t lead to use errors or user errors,” said NIST researcher Matt Quinn. “It will provide a way for developers and evaluators to objectively assess how easy their EHR systems are to learn and operate, while maximizing efficiency.”
The protocol is a three-step process consisting of an analysis of how the application functions, expert review, and validation testing of the user interface to make sure it works as intended.

The protocol includes general steps and guidance for evaluating an EHR user interface from a clinical perspective—does it contain, collect and display the information it needs to—and human factors perspectives—can the user understand it and easily find needed information. The interface is then tested by representative user groups performing realistic tasks.

+ Full Document (PDF)

NOAA — State of the Climate

March 16, 2012 Comments off

State of the Climate
Source: National Oceanic and Atmospheric Administration (National Climatic Data Center)

Warmer-than-average temperatures dominated the northern and eastern regions of the country in December, January and February, leading to the fourth warmest winter on record for the contiguous United States. The winter season was also drier-than-average for the Lower 48, with dry conditions experienced across the West and the Southeast but wetter-than-average conditions in the Central and Southern Plains and parts of the Ohio Valley.

The average contiguous U.S. temperature during the December-February period was 36.8 degrees F, 3.9 degrees F above the 1901-2000 long-term average — the warmest since 2000. The precipitation averaged across the nation was 5.70 inches, 0.78 inch below the long-term average.

Household Income Inequality Within U.S. Counties: 2006-2010

March 9, 2012 Comments off

Household Income Inequality Within U.S. Counties: 2006-2010Source: U.S. Census Bureau

This report presents measures of household income inequality for counties in the United States, based on data pooled from 5 years (2006 to 2010) of American Community Survey (ACS) data. For example, the data show that the more unequal counties were also more populous. Thirty-four percent of Americans lived in a county that ranked in the top 20 percent of U.S. counties by Gini index (the Gini index is a measure of income inequality). In every region, the counties in the most unequal fifth of U.S. counties accounted for a disproportionately large share of that region’s population. For example, only 8 percent of Midwestern counties had Gini indexes ranking among the top fifth of U.S. counties, but they contained 26 percent of the region’s population. Also, the South region had a disproportionately large number of counties with high income inequality, while counties in the Midwest had lower levels of income inequality. Specifically, 32 percent of the counties in the South had Gini indexes ranking among the top fifth of U.S. counties, while 31 percent of Midwest counties ranked among the bottom fifth of U.S. counties.
Internet address: <http://www.census.gov/prod/2012pubs/acsbr10-18.pdf>.

Follow

Get every new post delivered to your Inbox.

Join 316 other followers