Archive
Dynamics of Economic Well-Being: Participation in Government Programs, 2004 to 2007 and 2009 — Who Gets Assistance?
Dynamics of Economic Well-Being: Participation in Government Programs, 2004 to 2007 and 2009 — Who Gets Assistance?
Source: U.S. Census Bureau
Almost 45 million people, or 18.6 percent of the U.S. civilian noninstitutionalized population, participated in one or more major means-tested assistance programs each month in 2009. These statistics come from a new report that examines the participation and characteristics of people who received benefits from any of the major means-tested assistance programs including: Temporary Assistance for Needy Families, General Assistance, Supplemental Nutrition Assistance Program/Food Stamp, Supplemental Security Income, Medicaid and Housing Assistance. The statistics come from the 2004 and 2008 Panels of the Survey of Income and Program Participation and cover calendar years 2004 through 2007 and 2009. Internet address: <http://www.census.gov/prod/2012pubs/p70-130.pdf>
Texas Dominates List of Fastest-Growing Large Cities Since 2010 Census, Census Bureau Reports
Texas Dominates List of Fastest-Growing Large Cities Since 2010 Census, Census Bureau Reports
Source: U.S. Census Bureau
Texas had eight of the 15 most rapidly growing large cities between Census Day (April 1, 2010) and July 1, 2011, according to population estimates for all of the nation’s incorporated cities and towns and minor civil divisions released today by the U.S. Census Bureau.
“These estimates provide our first look at how much the total population has changed in each of our nation’s cities since we conducted the 2010 Census,” Census Bureau Director Robert Groves said. “These numbers provide further evidence of a continuation of the trend of rapid population growth in Texas we observed between the 2000 and 2010 censuses.”
Although Texas dominated the list as a whole, the fastest-growing large city was outside the state. Among cities with populations of 100,000 or more in 2010, New Orleans, still rebounding from the effects of Hurricane Katrina in 2005, ranked first, growing by 4.9 percent to 360,740. This puts the city’s population at 79.2 percent of the pre-Katrina July 1, 2005, estimate of 455,188.
One of Texas cities that made the list of fastest-growing cities — Round Rock — broke the 100,000 mark since the 2010 Census. Another, nearby Austin, cracked the 800,000 mark. (See Table 1 for complete list.)
Looking at the highest numerical growth, New York topped the list, adding nearly 70,000 people since the 2010 Census. Again, Texas was well-represented, with six cities among the top 15, including Houston, San Antonio and Austin, which ranked second, third and fourth, respectively. California checked in with three cities, including Los Angeles, San Diego and San Jose; Phoenix; Denver; Charlotte, N.C.; New Orleans; and Washington also made the list. (See Table 2 for a complete list.)
New York continued to be the nation’s most populous city by a large margin, with 8.2 million residents in 2011, followed by Los Angeles and Chicago. The 15 most populous cities remained unchanged since the 2010 Census. However, Austin, Texas, moved up from 14th to 13th in total population, supplanting San Francisco. (See Table 3 for complete list.)
Older Populations to Exceed Children in Most World Regions by 2050, Census Bureau Reports
Older Populations to Exceed Children in Most World Regions by 2050, Census Bureau Reports
Source: U.S. Census Bureau
The world’s inhabitants in 2012 are an older mix of people than was the case a decade ago, driven by declining fertility and increasing life expectancy. According to new U.S. Census Bureau population projections, by midcentury most world regions will resemble Europe, which in 2005 became the first major world region where the population 65 and older outnumbered those younger than 15.
Northern America, which includes Canada and the United States, will have joined Europe in this historic reversal of age group sizes by 2050, as will Asia, Latin America and Oceania (which includes Australia and New Zealand). Moreover, China is projected to move from having nearly twice as many people in the younger age group than in the older one in 2012, to the opposite situation by midcentury.
These projections come from an update of the Census Bureau’s International Data Base, which includes estimates by age and sex to 100 years and older for countries and other areas with populations of 5,000 or more and provides information on population size and growth, mortality, fertility and net migration. Since April 2012, users of the International Data Base have been able to obtain population in single years of age, allowing them to calculate country-specific populations in particular age groups (e.g., population at selected ages younger than 5, or adolescents).
Between now and the middle of the 21st century, global population will continue aging. The percentage of population 65 and older will more than double, from 8 percent today to nearly 17 percent in 2050, carrying with it well-established changes in the mix of communicable and noncommunicable disease patterns in populations, health care burden, pension systems, the composition and character of the labor force, and other economic variables, such as savings and consumption patterns.
One world region — Africa — will continue to have populations younger than 15 that are much larger than those 65 and older, but even there, the balance will have shifted toward the older group.
U.S. Employer Businesses Show Declines in Establishments and Employees in 2010, Census Bureau Reports
Source: U.S. Census Bureau
In 2010, U.S. businesses with paid employees numbered 7.4 million, a decline of 36,800 establishments from 2009, marking the third consecutive year of decline, according to the U.S. Census Bureau. In comparison, between 2008 and 2009 there was a decline of 168,000 establishments.
These findings are from County Business Patterns: 2010, which provides the only detailed annual information on the number of establishments, employees, and first-quarter and annual payroll for most of the 1,100 industries covered at the national, state and county levels. The statistics are broken down according to employment-size classes (for example, number of establishments with one to four employees) and legal form of organization (for example, corporations and partnerships).
In 2010, total employment from all sectors was 112.0 million, a decline of 2.5 million employees from 2009. In comparison, between 2008 and 2009 there was a decline of 6.4 million employees.
Monthly Child Support Payments Average $430 per Month in 2010, Census Bureau Reports
Monthly Child Support Payments Average $430 per Month in 2010, Census Bureau Reports
Source: U.S. Census Bureau
Monthly child support payments in the United States averaged $430 per month in 2010, according to new U.S. Census Bureau statistics.
The statistics from Support Providers: 2010 show that 59 percent of the $41.7 billion in total payments were for child support for children under 21 ($24.4 billion), which was paid by 4.8 million parents. The remainder was paid to children over 21, parents, and other relatives or nonrelatives of the providers. Monetary support in 2010 was primarily for children, although it also included support for other nonhousehold members, such as parents or other relatives.
D.C. Leads Nation as U.S. Per Pupil Tops $10,600, Census Bureau Reports
D.C. Leads Nation as U.S. Per Pupil Tops $10,600, Census Bureau Reports
Source: U.S. Census Bureau
The nation’s elementary-secondary public school systems spent an average of $10,615 per pupil in fiscal year 2010, up 1.1 percent from the previous year, according to statistics released today by the U.S. Census Bureau. District of Columbia public schools spent $18,667 per student in 2010, which is the most of any state or state equivalent. States that spent the most per pupil were New York ($18,618), New Jersey ($16,841), Alaska ($15,783), Vermont ($15,274) and Wyoming ($15,169). (See table 11. Excel | PDF).
These statistics come from Public Education Finances: 2010, a Census Bureau report that provides tables and figures on revenues, expenditures, debt and assets (cash and security holdings) of the nation’s elementary and secondary public school systems for the 2010 fiscal year. The tables include detailed statistics on spending — such as instruction, student transportation, salaries and employee benefits — at the national, state and school district levels.
Public school systems received $593.7 billion in funding in 2010, up 0.5 percent from the prior year. Of that amount, local governments contributed $261.4 billion (44.0 percent), followed by revenue raised from state sources, which contributed $258.2 billion (43.5 percent), and federal sources, which provided the remaining $74.0 billion (12.5 percent).
Revenue from state sources decreased by $18.0 billion, a 6.5 percent decrease from 2009. This is the largest decrease in state funding from the prior year since the Census Bureau began publishing school system finance statistics on an annual basis in 1977 and only the second year since 1977 in which state funding decreased from the prior year (revenue from state sources also decreased 1.7 percent between 2008 and 2009).
Revenue from federal sources increased by $18.1 billion, a 32.5 percent increase from 2009 and the largest increase in federal funding for public school systems since 1977.
Total expenditures by public school systems were $602.6 billion, a 0.4 percent decrease from 2009. This decrease in total expenditures marks the first time since the Census Bureau began publishing school system finance statistics on an annual basis that expenditures by public school systems decreased from the prior year. In 2010, current spending increased 1.2 percent to $524.0 billion, of which $317.8 billion went to instruction and $179.0 billion to support services, such as student transportation and general administration. Capital outlay expenditures amounted to $59.4 billion, a 12.8 percent decrease from 2009.
Census Bureau Report Shows Shared Households Increased 11.4 Percent from 2007 to 2010
Census Bureau Report Shows Shared Households Increased 11.4 Percent from 2007 to 2010
Source: U.S. Census Bureau
In 2010, there were 22.0 million shared households in the United States, an 11.4 percent increase from 2007, according to a new U.S. Census Bureau report. This total of shared households accounted for 18.7 percent of all households, up from 17.0 percent in 2007.
The report, Sharing a Household: Household Composition and Economic Well-Being: 2007-2010 [PDF], analyzes data on household composition and income from the Annual Social and Economic Supplement of the Current Population Survey. The report reveals that adults joined or combined their households in greater numbers and in higher proportions following the most recent recession than they did prior to the recession.
In spring 2007, there were 19.7 million shared households — defined as a household with at least one “additional” adult. An additional adult is a person 18 or older who is not enrolled in school and is neither the householder, the spouse nor the cohabiting partner of the householder. By spring 2010, the number of shared households had increased to 22.0 million while all households increased by only 1.3 percent.
Census Bureau Releases Estimates of Undercount and Overcount in the 2010 Census
Census Bureau Releases Estimates of Undercount and Overcount in the 2010 Census
Source: U.S. Census Bureau
The U.S. Census Bureau released today results from its post-enumeration survey, providing a measure of the accuracy of the 2010 Census. The results found that the 2010 Census had a net overcount of 0.01 percent, meaning about 36,000 people were overcounted in the census. This sample-based result, however, was not statistically different from zero.
The post-enumeration survey, called “Census Coverage Measurement,” measures the coverage of the nation’s household population (excluding the 8.0 million people in “group quarters,” such as nursing homes or college dorms). It surveys a sample of the 300.7 million people living in housing units and then matches the responses to the census, resulting in estimates of error.
The 2000 Census had an estimated net overcount of 0.49 percent and the 1990 Census had a net undercount of 1.61 percent.
“On this one evaluation — the net undercount of the total population — this was an outstanding census,” Census Bureau Director Robert Groves said. “When this fact is added to prior positive evaluations, the American public can be proud of the 2010 Census their participation made possible.”
Most Children Younger Than Age 1 are Minorities, Census Bureau Reports
Most Children Younger Than Age 1 are Minorities, Census Bureau ReportsSource: U.S. Census Bureau
The U.S. Census Bureau today released a set of estimates showing that 50.4 percent of our nation’s population younger than age 1 were minorities as of July 1, 2011. This is up from 49.5 percent from the 2010 Census taken April 1, 2010. A minority is anyone who is not single-race white and not Hispanic.
The population younger than age 5 was 49.7 percent minority in 2011, up from 49.0 percent in 2010. A population greater than 50 percent minority is considered “majority-minority.”
These are the first set of population estimates by race, Hispanic origin, age and sex since the 2010 Census. They examine population change for these groups nationally, as well as within all states and counties, between Census Day (April 1, 2010) and July 1, 2011. Also released were population estimates for Puerto Rico and its municipios by age and sex.
There were 114 million minorities in 2011, or 36.6 percent of the U.S. population. In 2010, it stood at 36.1 percent.
There were five majority-minority states or equivalents in 2011: Hawaii (77.1 percent minority), the District of Columbia (64.7 percent), California (60.3 percent), New Mexico (59.8 percent) and Texas (55.2 percent). No other state had a minority population greater than 46.4 percent of the total.
More than 11 percent (348) of the nation’s 3,143 counties were majority-minority as of July 1, 2011, with nine of these counties achieving this status since April 1, 2010. Maverick, Texas, had the largest share (96.8 percent) of its population in minority groups, followed by Webb, Texas (96.4 percent) and Wade Hampton Census Area, Alaska (96.2 percent).
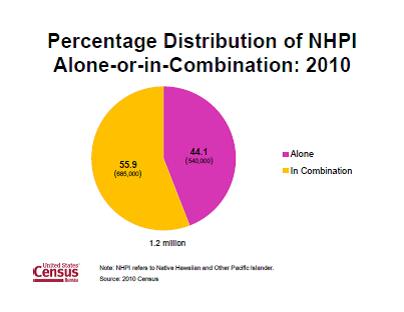
2010 Census Shows More than Half of Native Hawaiians and Other Pacific Islanders Report Multiple Races
2010 Census Shows More than Half of Native Hawaiians and Other Pacific Islanders Report Multiple Races
Source: U.S. Department of the Census
The U.S. Census Bureau released today a 2010 Census brief, The Native Hawaiian and Other Pacific Islander Population: 2010 [PDF], that shows more than half (56 percent) of this population, or 685,000 people, reported being Native Hawaiian and Other Pacific Islander in combination with one or more other races. This multiracial group grew by 44 percent from 2000 to 2010.
Overall, 1.2 million people, or 0.4 percent of all people in the United States, identified as Native Hawaiian and Other Pacific Islander (NHPI), either alone or in combination with one or more races. This population grew by 40 percent from
2000 to 2010. Those who reported being Native Hawaiian and Other Pacific Islander alone totaled 540,000, an increase of 35 percent from 2000 to 2010. The multiple-race Native Hawaiian and Other Pacific Islander population, as well as both the alone and alone-or-in-combination populations, all grew at a faster rate than the total U.S. population, which increased by 9.7 percent from 2000 to 2010.
Census Bureau Reports Foreign-Born Households are Larger, Include More Children and Grandparents
Census Bureau Reports Foreign-Born Households are Larger, Include More Children and Grandparents
Source: U.S. Census Bureau
The U.S. Census Bureau reported today that foreign-born households are, on average, larger than native households, have more children under age 18, and are more likely to be multigenerational.
The average size of foreign-born households (3.4 people) was larger than that of native-born households (2.5 people). About 62 percent of foreign-born family households included children under 18, compared with 47 percent of native-born households. Multigenerational households, with three or more generations living together, were more common among foreign-born (10 percent) than native-born (5 percent) family households.
Among the regions of birth, family households with a householder born in Latin America and the Caribbean were the most likely to include children under 18 (70 percent), followed by Africa (67 percent), Oceania (60 percent) and Asia (56 percent). Families with a householder born in Northern America or Europe (both less than 40 percent) were less likely to include children under 18 than native-born households. (Oceania consists of Australia, New Zealand, Melanesia, Micronesia and Polynesia; Northern America consists of Canada, Bermuda, Greenland, and St. Pierre and Miquelon.)
A family household consists of a householder and one or more people living together who are related to the householder by birth, marriage or adoption. About 77 percent of foreign-born households were family households, compared with 65 percent of native-born households.
These data come from The Foreign-Born Population in the United States: 2010, a new report about the characteristics of the nation’s foreign-born population from the 2010 American Community Survey (ACS). The report also examines differences among foreign-born region-of- birth groups on a wide range of topics that include age, sex, marital status, fertility, period of entry into the United States, naturalization and citizenship status, language, education, labor force participation, occupation, health insurance coverage, income and poverty.
“There is considerable variation among the different foreign-born groups in household type and composition,” said Elizabeth M. Grieco, chief of the Census Bureau’s Foreign-Born Population Branch and one of the authors of the report. “This diversity is also seen in the other demographic, social and economic characteristics covered in this report.”
+ Full Report (PDF)
2010 Business Dynamics Statistics (BDS)
2010 Business Dynamics Statistics (BDS)
Source: U.S. Census Bureau
This Census Bureau brief highlights the most recent update to the Business Dynamics Statistics, which found that U.S. business startups have been declining since the 1980s and especially during the 2008-2009 recession. The report concludes that the U.S. has become less entrepreneurial as a result of the decline in startups and the lack of activity by young businesses. The BDS, which provides annual statistics from 1976 to 2010 by firm age and size, is crucial to understanding current and historical U.S. entrepreneurial activity. The BDS results from collaboration between the U.S. Census Bureau’s Center for Economic Studies and the Ewing Marion Kauffman Foundation, the largest American nonprofit organization that focuses on entrepreneurship. Internet address: <http://www.kauffman.org/bds2012>.
Further information on the BDS release can be found at <http://www.census.gov/ces/dataproducts/bds/data.html>.
2010 Census Shows Interracial and Interethnic Married Couples Grew by 28 Percent over Decade
2010 Census Shows Interracial and Interethnic Married Couples Grew by 28 Percent over Decade
Source: U.S. Census Bureau
The U.S. Census Bureau today released a 2010 Census brief, Households and Families: 2010, that showed interracial or interethnic opposite-sex married couple households grew by 28 percent over the decade from 7 percent in 2000 to 10 percent in 2010. States with higher percentages of couples of a different race or Hispanic origin in 2010 were primarily located in the western and southwestern parts of the United States, along with Hawaii and Alaska.
A higher percentage of unmarried partners were interracial or interethnic than married couples. Nationally, 10 percent of opposite-sex married couples had partners of a different race or Hispanic origin, compared with 18 percent of opposite-sex unmarried partners and 21 percent of same-sex unmarried partners.
+ Households and Families: 2010 (PDF)
Census Estimates Show New Patterns of Growth Nationwide
Census Estimates Show New Patterns of Growth NationwideSource: U.S. Census Bureau
Among the 50 fastest-growing metro areas over the last decade, only 24 of them were also among the 50 fastest growing since the 2010 Census. This is according to the first set of U.S. Census Bureau metropolitan statistical area, micropolitan statistical area and county population estimates to be published since the official 2010 Census population counts were released a year ago.
“Our nation is constantly changing, and these estimates provide us with our first measure of how much substate areas have grown or declined in total population since Census Day, April 1, 2010,” Census Bureau Director Robert Groves said. “We’re already seeing different patterns of population growth than we saw in the last decade.”
According to the new July 1, 2011, population estimates released today, the relative growth of many of the nation’s 366 metro areas in the 15-month period from April 2010 to July 2011 differed markedly from that observed between 2000 and 2010. One such example was Palm Coast, Fla., which was the fastest-growing metro area between 2000 and 2010, but fell to 55th place between 2010 and 2011. Similarly, Las Vegas, the third fastest-growing metro area between 2000 and 2010, fell to 151st place. Some metro areas showed less change: St. George, Utah, the second fastest-growing metro area between 2000 and 2010, dropped only to 11th place.
Conversely, New Orleans, which experienced the greatest percentage loss between 2000 and 2010, was 35th in metro area percentage growth between 2010 and 2011. Besides New Orleans, there were nine metro areas that were not among the 100 fastest growing between 2000 and 2010 but were among the 50 fastest growing from 2010 to 2011: Hinesville-Fort Stewart, Ga.; Columbus, Ga.-Ala.; Odessa, Texas; Fayetteville, N.C.; Oklahoma City, Okla.; Bismarck, N.D.; Miami-Fort Lauderdale-Pompano Beach, Fla.; Gulfport-Biloxi, Miss.; and Hattiesburg, Miss.
Kennewick-Pasco-Richland, Wash., and Austin-Round Rock-San Marcos, Texas, were the nation’s two fastest-growing metro areas between 2010 and 2011, with population increases of 4.3 percent and 3.9 percent, respectively.
Facts for Features Special Edition — 1940 Census Records Release
Facts for Features Special Edition — 1940 Census Records ReleaseSource: U.S. Census Bureau
On April 2, the National Archives and Records Administration will make individual records from the 1940 Census available to the public for the first time. The 1940 Census was conducted during a momentous time in our nation’s history, as the Great Depression was winding down and not long before our entry into World War II (although the war was already raging in Europe). It marked the only census conducted during the lengthy presidency of Franklin D. Roosevelt. It was also notable for many other reasons, as detailed below. In this edition of Profile America Facts for Features, we compare notable 1940 Census facts with corresponding information from the 2010 Census. Included is an early look at plans for the 2020 Census.
Census Bureau Releases First Information Since 2000 Census on Moves Between Counties
Census Bureau Releases First Information Since 2000 Census on Moves Between Counties
Source: U.S. Census Bureau
The U.S. Census Bureau today released estimates from the American Community Survey showing how many people migrated from one specific county to another during the course of a year ─ the first such numbers published since these data were collected as part of the 2000 Census.
The American Community Survey compiles data over a five-year period and asks people where they lived one year prior to being surveyed. The first five-year estimates released covers the years from 2005 to 2009.
The 2005-2009 American Community Survey County-to-County Migration Files provide tables for each county in the nation, showing both “inflows” and “outflows.” Inflows are the number of people living in a given county who lived in another specific county one year earlier; outflows represent the number of people who lived in a particular county one year earlier who subsequently moved to another specific county.
Of the 48.1 million people who lived in a different residence in the United States one year earlier, 17.7 million lived in a different county.
Maricopa, Ariz., had the largest number of inflows of people for any single county in the nation. People moved there from 993 different counties. Similarly, Maricopa led the nation with the largest number of counties in which it sent outflows of people ─ a total of 1,156 counties. This means that individuals leaving Maricopa were more dispersed throughout the country than individuals leaving any other county. Pinal, Ariz. (13,452 residents); Los Angeles (12,403); Pima, Ariz. (7,349); San Diego (6,693); and Coconino, Ariz. (3,994) were among the counties with the highest number of people moving into Maricopa.
Pinal (21,974), Pima (8,464), San Diego (4,156), Los Angeles (3,813) and Coconino (3,188) were among the counties with the highest number of moves out of Maricopa.
All in all, the most common county-to-county moves nationally were from Los Angeles to San Bernardino, Calif. (48,456 people) and Los Angeles to Orange, Calif. (41,612). Los Angeles to Riverside, Calif. (29,710); Orange, Calif., to Los Angeles (29,345); and Miami-Dade to Broward, Fla. (27,010) were among the next most common county-to-county moves.
Additionally, Los Angeles had both the highest number of people entering from another county as well as the highest number leaving for another county. On balance, however, it lost a net of about 160,000 people in this exchange.
Household Income Inequality Within U.S. Counties: 2006-2010
Household Income Inequality Within U.S. Counties: 2006-2010Source: U.S. Census Bureau
This report presents measures of household income inequality for counties in the United States, based on data pooled from 5 years (2006 to 2010) of American Community Survey (ACS) data. For example, the data show that the more unequal counties were also more populous. Thirty-four percent of Americans lived in a county that ranked in the top 20 percent of U.S. counties by Gini index (the Gini index is a measure of income inequality). In every region, the counties in the most unequal fifth of U.S. counties accounted for a disproportionately large share of that region’s population. For example, only 8 percent of Midwestern counties had Gini indexes ranking among the top fifth of U.S. counties, but they contained 26 percent of the region’s population. Also, the South region had a disproportionately large number of counties with high income inequality, while counties in the Midwest had lower levels of income inequality. Specifically, 32 percent of the counties in the South had Gini indexes ranking among the top fifth of U.S. counties, while 31 percent of Midwest counties ranked among the bottom fifth of U.S. counties.
Internet address: <http://www.census.gov/prod/2012pubs/acsbr10-18.pdf>.
Bachelor’s Degree Attainment Tops 30 Percent for the First Time, Census Bureau Reports
Bachelor’s Degree Attainment Tops 30 Percent for the First Time, Census Bureau ReportsSource: U.S. Census Bureau
In March 2011, for the first time ever, more than 30 percent of U.S. adults 25 and older had at least a bachelor’s degree, the U.S. Census Bureau reported today. As recently as 1998, fewer than one-quarter of people this age had this level of education.
From 2001 to 2011, the number of Hispanics with a bachelor’s or higher education increased 80 percent from 2.1 million to 3.8 million. The percentage of Hispanics with a bachelor’s or higher education increased from 11.1 percent in 2001 to 14.1 percent in 2011. Overall, the increase in the proportion of the population with a bachelor’s degree or higher went from 26.2 percent to 30.4 percent.
“This is an important milestone in our history,” Census Bureau Director Robert Groves said. “For many people, education is a sure path to a prosperous life. The more education people have the more likely they are to have a job and earn more money, particularly for individuals who hold a bachelor’s degree.”
School Enrollment in the United States: 2010
School Enrollment in the United States: 2010Source: U.S. Census Bureau
These national statistics describe a wide variety of student characteristics at all levels of school, from nursery to graduate. The tables provide information by age, sex, race, Hispanic origin, family income, type of college, employment status and vocational course enrollment. The statistics are produced from the October School Enrollment Supplement to the Current Population Survey; historical tables are provided. Internet address: <http://www.census.gov/hhes/school/data/cps/2010/tables.html>.
Estimates of State Voting-Age Population: July 1, 2011
Estimates of State Voting-Age Population: July 1, 2011
Source: U.S. Census Bureau
Estimates of the number of people 18 and older in each state and Puerto Rico. The downloadable file will also include total population and the percentage of people 18 and older. These are the first estimates since 2010 Census tabulations were released. Internet address: <http://www.census.gov/popest/data/datasets.html#state>.
